Casting pressure
Filling pressure which occurs in the mold cavity during casting, i.e. the end pressure in the die casting mold.The higher the casting pressure, the higher the gate speed. However, when calculating the casting pressure, it must be considered that flow resistances occur in areas where the size of the cross section and direction change, on corners and edges and where the walls are rough, which must be overcome. If the sum of these resistances are described by a dimensionless value, the coefficient of resistance ξ, the metal pressure can be calculated using Eq. 1:
Eq. 1 : 
Here the letters signify the following:
pG = metal pressure in N/m² (1 bar = 105 N/m2); ρL = density of the liquid metal in kg/m3;va = gate speed in m/s; ξ = coefficient of resistance (dimensionless)If the coefficient of resistance is known, the casting pressure which is required to reach a desired gate speed can be calculated. If another value is included, the volume flow Q of the liquid metal which gives the flow amount per unit of time in m³/s and represents the product of the gate speed and the flow cross sectional area in the gate Q = va · Aa, from Eq. 1 we get Eq. 2:
Eq. 2: 
Here the letters signify:
pG = metal pressure in N/m² (1 bar = 105 N/m2); ρL = density of the liquid metal in kg/m3; Q = volume flow of the liquid metal in m³/s; ξ = coefficient of resistance (dimensionless); Aa = gate cross section in m2
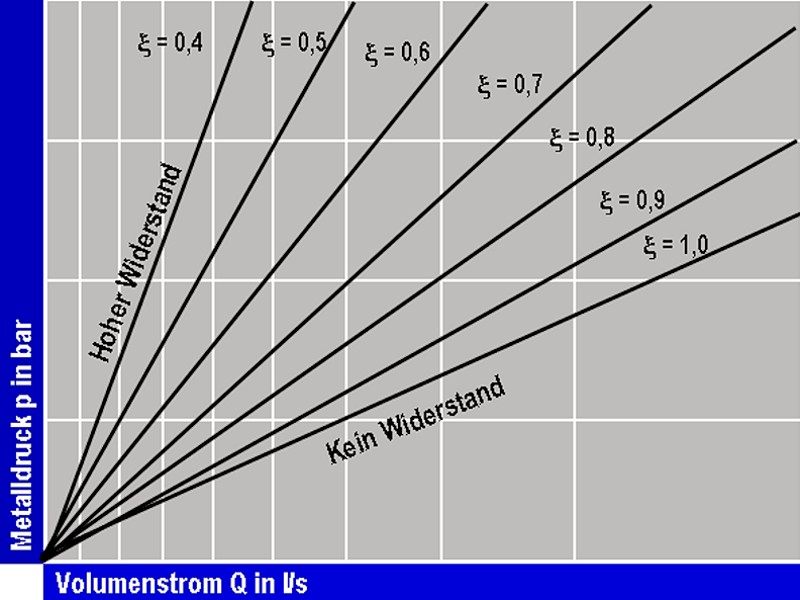
This relationship between the metal pressure and volume flow can be shown in a graph. As shown from Eq. 2, the required casting pressure for the chosen alloy and a given gate cross section is proportional to the square of the volume flow. Therefore, if, to represent the pressure as a function of the volume flow, a linear y-axis scale is chosen for p and a square scale for Q for the x-axis (p-Q2 diagram, see Figure 1), depending on the coefficient of resistance (usually between 0.6 and 0.8), this results in a straight line based on the origin of coordinates. This is the resistance line in the p-Q2 diagram.