Cupola oven network diagram
The direct link between blast rate and throughput, on the one hand, and blast rate and iron temperature, on the other hand, results in the optimum performance of a cupola furnace also being related to throughput.
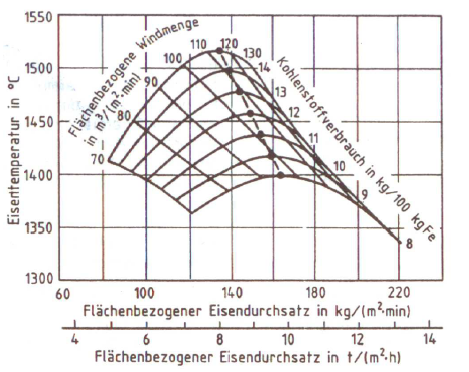
Therefore, there is a mutual relationship between the melting rate, blast rate, coke split (carbon) and iron temperature which can be illustrated in a cupola furnace network diagram. Fig. 1 shows such a diagram based on a cold-blast cupola furnace with constant coke split and discontinuous iron discharge.
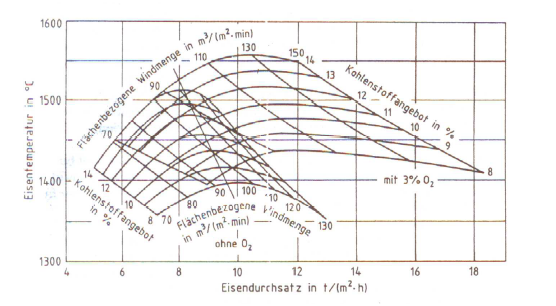
As can be seen, the melting rate can be increased by raising the blast rate at a constant carbon supply. Moreover, the iron temperature rises up to a maximum value which then defines the optimum operating state of the cold-blast furnace. Although an increase in throughput can be achieved in the overblowing range, this is connected with temperature losses, aggravated oxidizing conditions, i.e. higher oxygen load and an associated increase in oxidation-related losses (Fig. 2), and finally higher dust emissions.Accordingly, cupola furnace network diagrams accurately describe changes in furnace operation. Fig. 3 illustrates the impact of blast enrichment with 3% oxygen on melting rate and iron temperature. The network clearly shifts to the top right, i.e. to higher iron temperatures and higher throughputs. The temperature curve is also noticeably flatter in the maximum range than without O2 enrichment, which constitutes an advantage since overblowing cannot occur as quickly as with higher melting rates. Finally, this extends the optimum performance range of the furnace.
Additional references:
Franz Neumann, Gusseisen: Schmelztechnik, Metallurgie, Schmelzbehandlung, 2nd edition, 1999, expert-Verlag