Graphite classification chart
Range of typical but idealized structural images (s. Structure or Micrograph) for classification of graphite formation and graphite structures for the purpose of microscopic inspection of cast iron. This classification chart is standardized in DIN EN ISO 945-1.
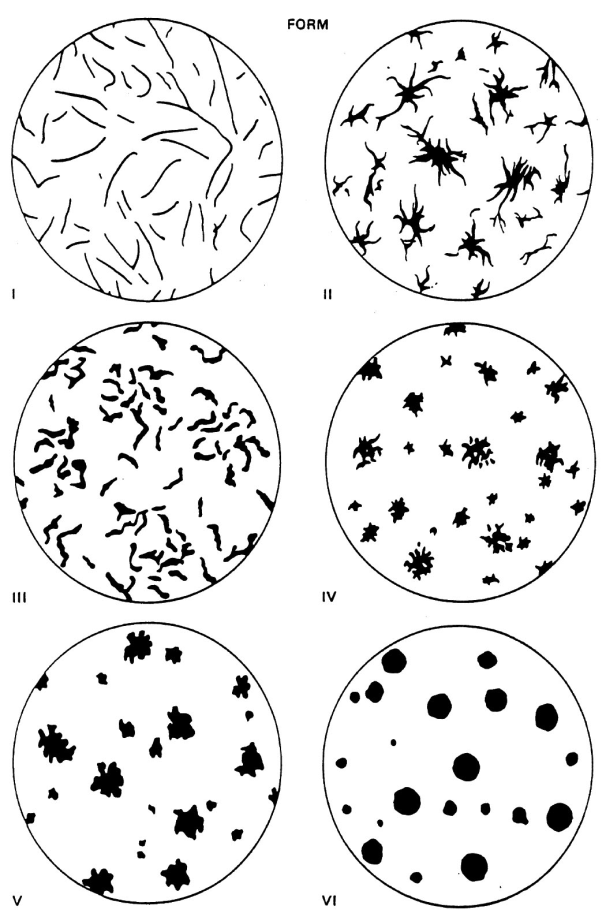
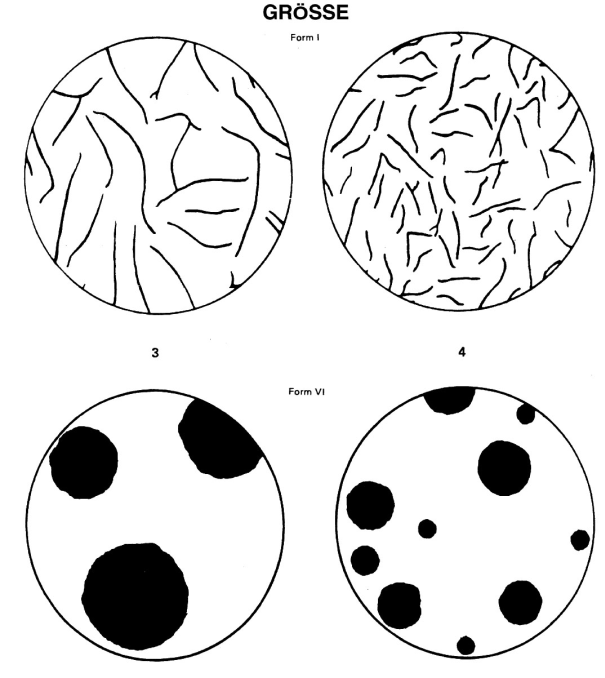
The classification chart for graphite form (Fig. 1) illustrates the main types of graphite, which can be divided in six characteristic forms. In practice it is a matter of course that a variety of intermediate or transitional forms exist.
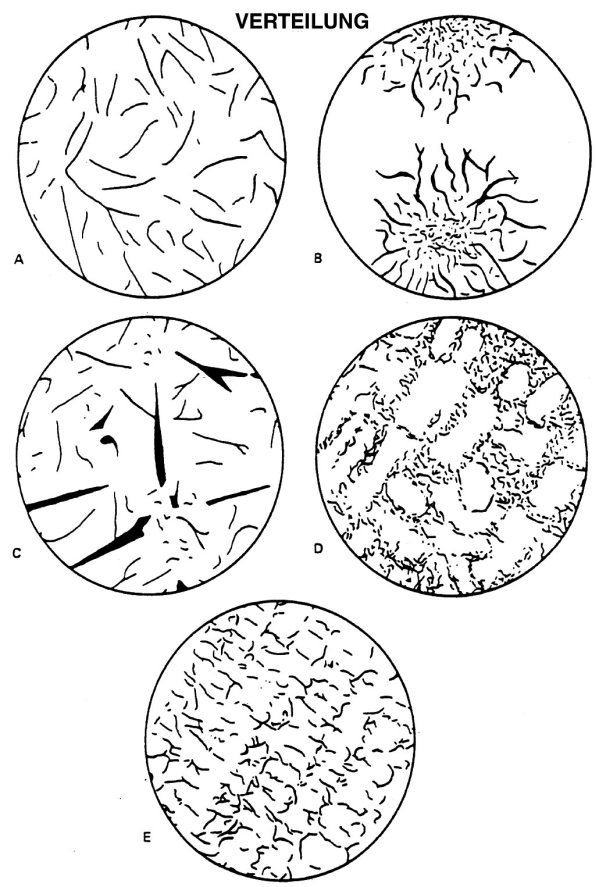
The classification chart for form I graphite distribution (Figure 2) is divided in five different types of distribution; illustration is also idealized here. Other distribution patterns and transitional forms may occur.
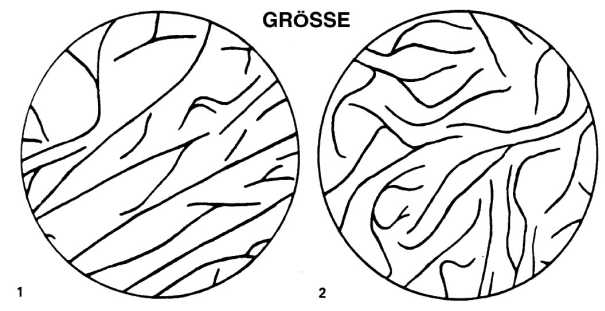
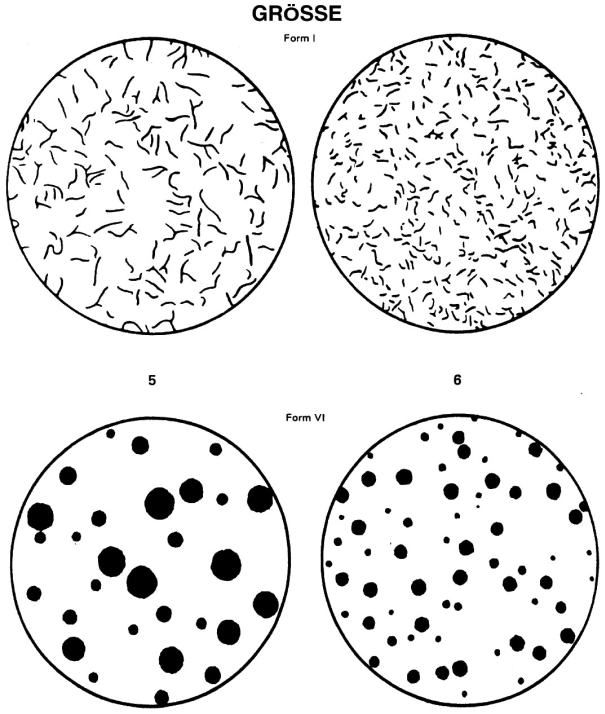
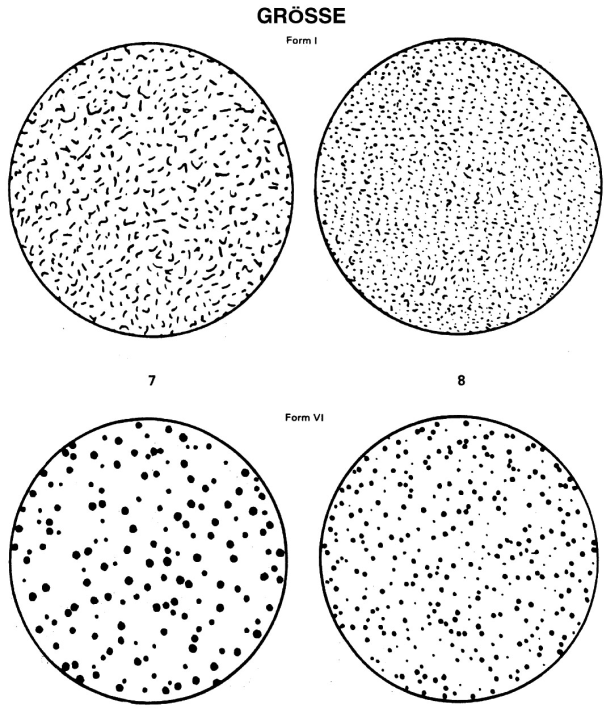
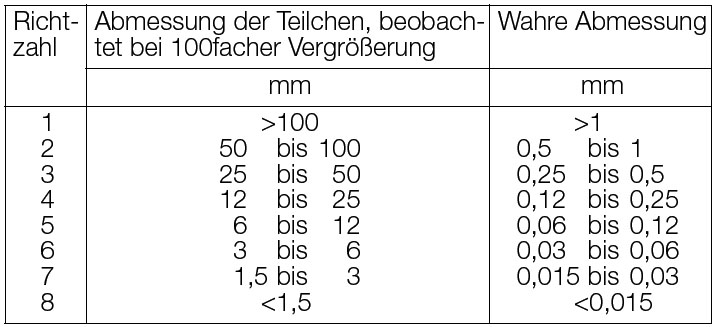
Figures 3 to 6, as well as Table 1 , which contains a description of the coefficients from the figures, are used for definition of the graphite size. For all images a 100-fold magnification is taken as a basis.
For description of a type of graphite, specifications for form, distribution, and size of the graphite particels are required (s. Figures and Table 1). Consequently, the following exemplary designation "I A 4” means that particles of form I, distribution A, and a maximum length of 12 to 25 mm are present, again with 100-fold magnification.
We point out again that the present graphite classification charts only represent an overview of the major types of graphite formation and merely ought to be used for comparison.
Additional references:
Eutectic graphite quantity
Degeneration of graphite
Nodular graphite cast iron
Flake graphite cast iron
Compacted graphite iron