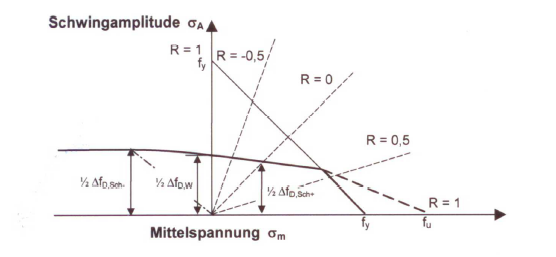
Haigh diagram
The stress amplitude δA applied via the average stress results in the Haigh diagram (fig. 1).
The diagram illustrates the dependence of a stress amplitude on an effective initial stress, internal stress or average stress. This way, the dependence of endurance strength on the type of stress (only pressure, pressure and tension, only tension or additionally bending and torsion) is illustrated.
Lines through the origin can be drawn marking the values for an identical stress ratio R. This way, the values for the endurable stress amplitude under the present stress conditions can also be determined. Please note that only half the value of the constantly endurable stress amplitude can be determined. The validity range of the diagram is also here limited by a yield strength line to prevent inadmissible elongations.
Additional references:
Fatigue failure
Fatigue test
Wöhler curve