Structure formation of cast iron
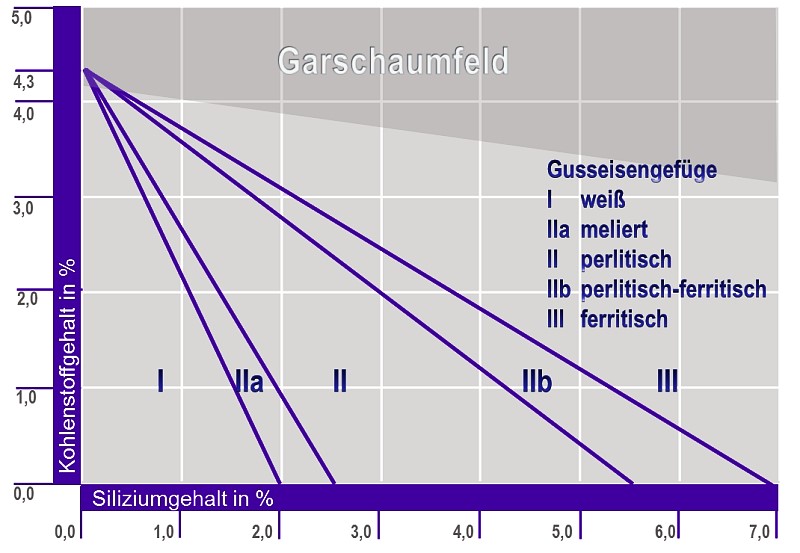
The Maurer diagram shows the influence of carbon and silicon contents on the structure of cast iron (see Metal matrix of cast iron), determined on the basis of 30mm test rods, and was developed by E. Maurer in 1924.
The lines in the diagram (Fig. 1) meet at 4.3% at the carbon axis, i.e. in the eutectic point of the iron-carbon system, and divide the diagram into three main fields:
I White cast iron, chilled cast iron (see Carbidic cast iron) (I)
II Gray cast iron with pearlitic structure (II)
III Gray cast iron with ferritic structure (III)
The transition zones indicate white cast iron grades with a mottled structure (IIa, a mixture of white and gray cast iron) and pearlitic-ferritic cast iron (IIb). The limit in the direction of higher carbon contents in the upper part of the diagram is defined by the field in which formation of kish graphite occurs (transparent gray in Fig. 1).
Both the strength and hardness of the cast iron increase, as the carbon and silicon contents rise. Therefore, cast iron grades of high quality have a composition which is found in the lower left area of the relevant field. E. Maurer created this diagram only for specimens of medium wall thicknesses (diameter of 30mm!). Moreover, the specimens were cast in dry molds. Accordingly, the influence of the cooling rate is not taken into account and is not included in Fig. 1.
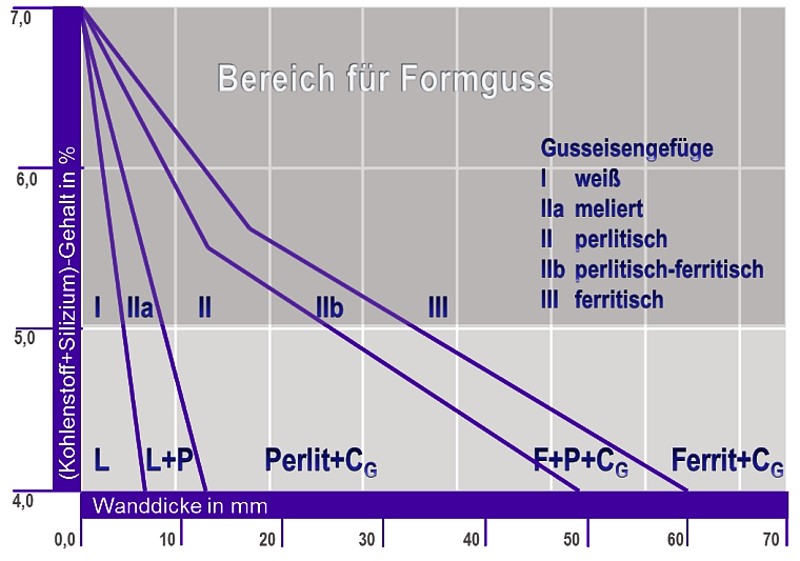
The diagram of Greiner-Klingenstein (Fig. 2), however, illustrates the correlation between the structure formation of cast iron and the cooling conditions, i.e. the wall thickness. Since both carbon and silicon have an effect on graphite precipitation, the total content of C+Si was plotted against the wall thickness in this diagram. The field descriptions are identical to those of the Maurer diagram. The break points in the upper limit lines indicate that the total content of carbon and silicon should be below 5.5%. Thus, in connection with the Maurer diagram, the diagram of Greiner-Klingenstein gives a better and more precise overview of the structure formation of cast iron.
Literature:
Bargel H. J., Schulze G. (eds.), Werkstoffkunde, Springer-Verlag, Berlin Heidelberg, 2008.