Thermal Analysis
A method for determining phase transformations from specific stopping points in cooling or heating curves of alloys or high-purity materials.
According to DIN 510051, the generic term thermal analysis is used to describe measurement methods that analyze the change in a selected property of a sample when the temperature of the sample is forced to change. Different process designations are defined depending on the sample properties to be investigated. The temperature is measured on the basis of various contact and non-contact methods.
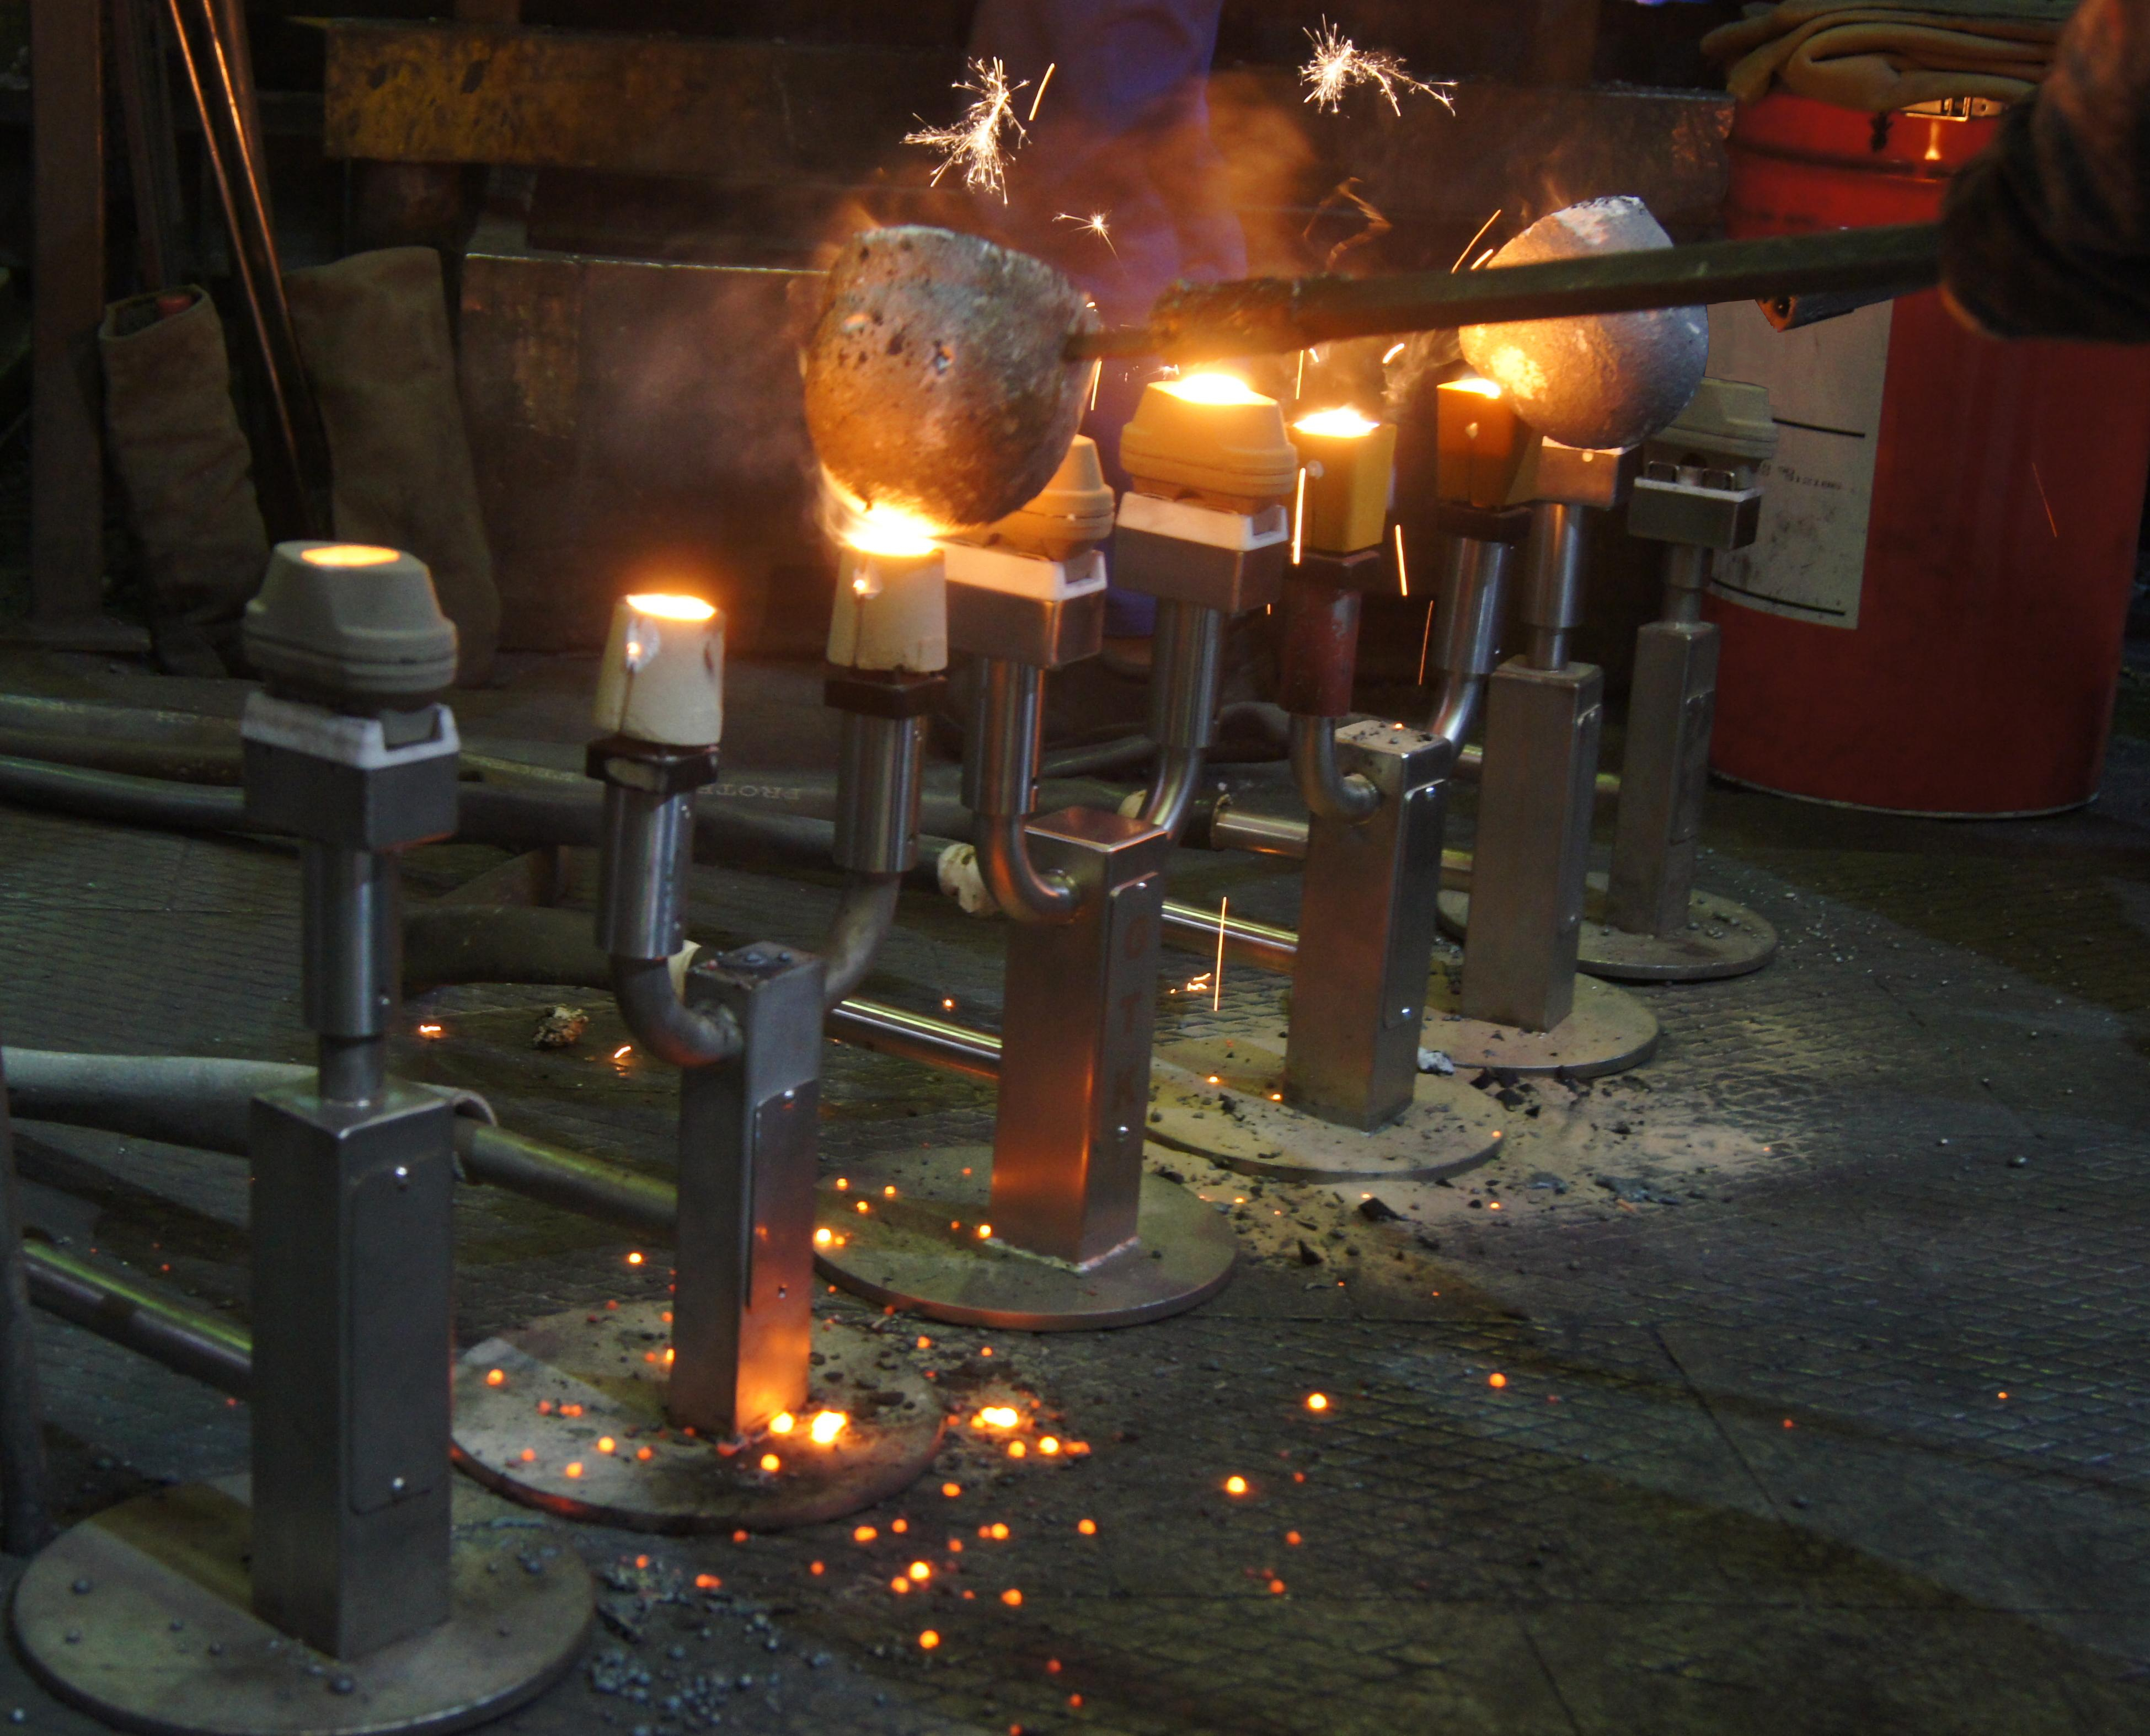
In foundry technology, thermal analysis is generally used to classify a metallic melt in the associated phase diagram using a cooling curve recorded during the process (see Fig. 1, Technical Service Kuehn GmbH). On this basis, the method offers the possibility of determining the composition, making statements on the solidification and transformation morphology and deriving corresponding expected values for the mechanical properties of the castings. Usually, disposable temperature sensors based on thermocouples are used for this purpose, whereby a wide variety of temperature sensor types (cups) exist, which mainly differ in the solidification time (see Fig. 2, apromace data systems GmbH, Technical Service Kuehn GmbH).
On the basis of the measured temperatures and the cooling curve obtained, decisive statements can be made about the events during solidification. Table 1 shows a compilation of important events of the cooling curve based on VDG data sheet P 350:
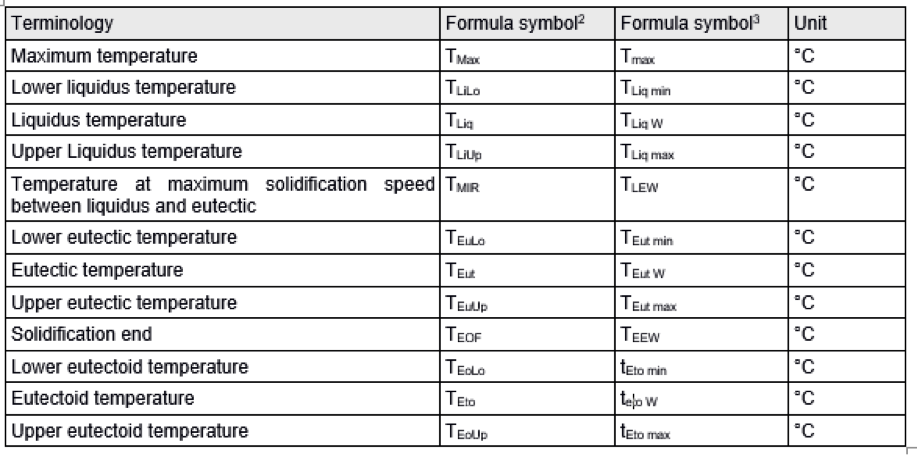
Table 1: Terms and symbols for the representation of the results of the analysis of the events of the cooling curves of molten metals.
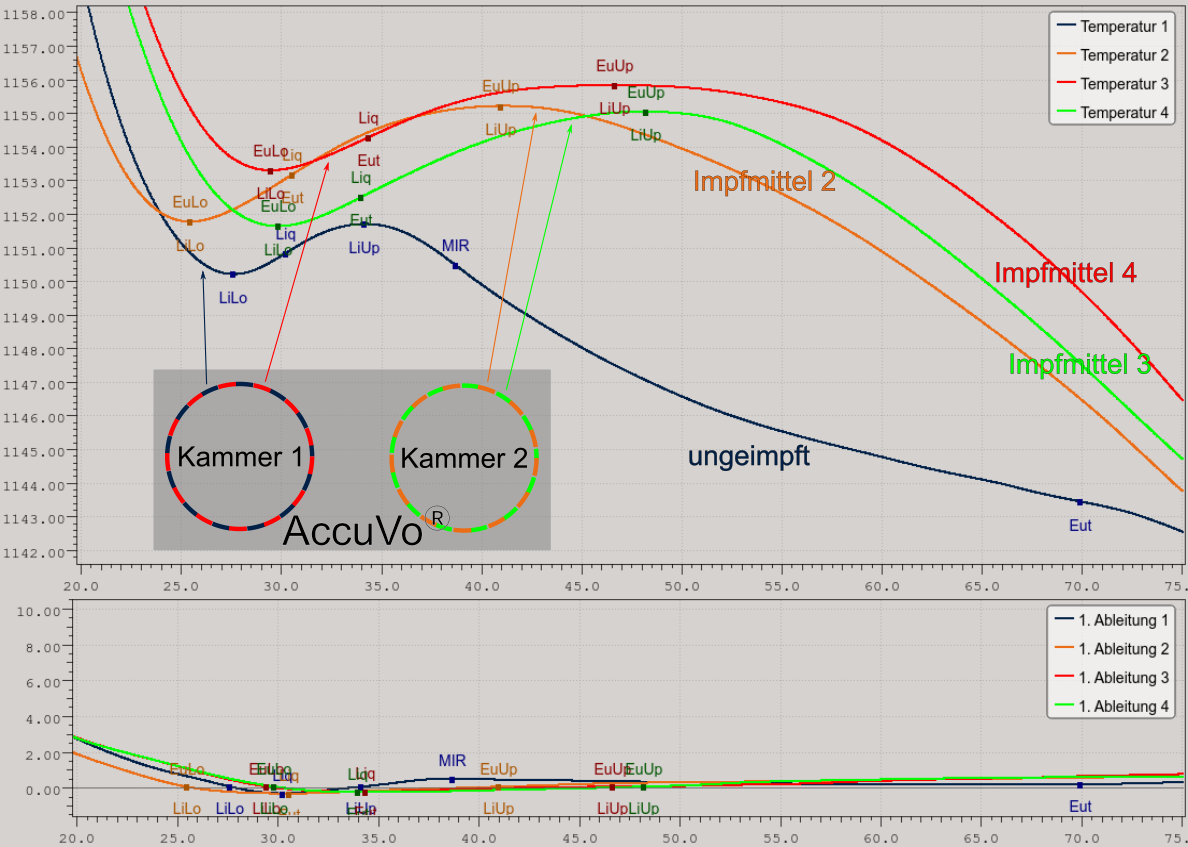
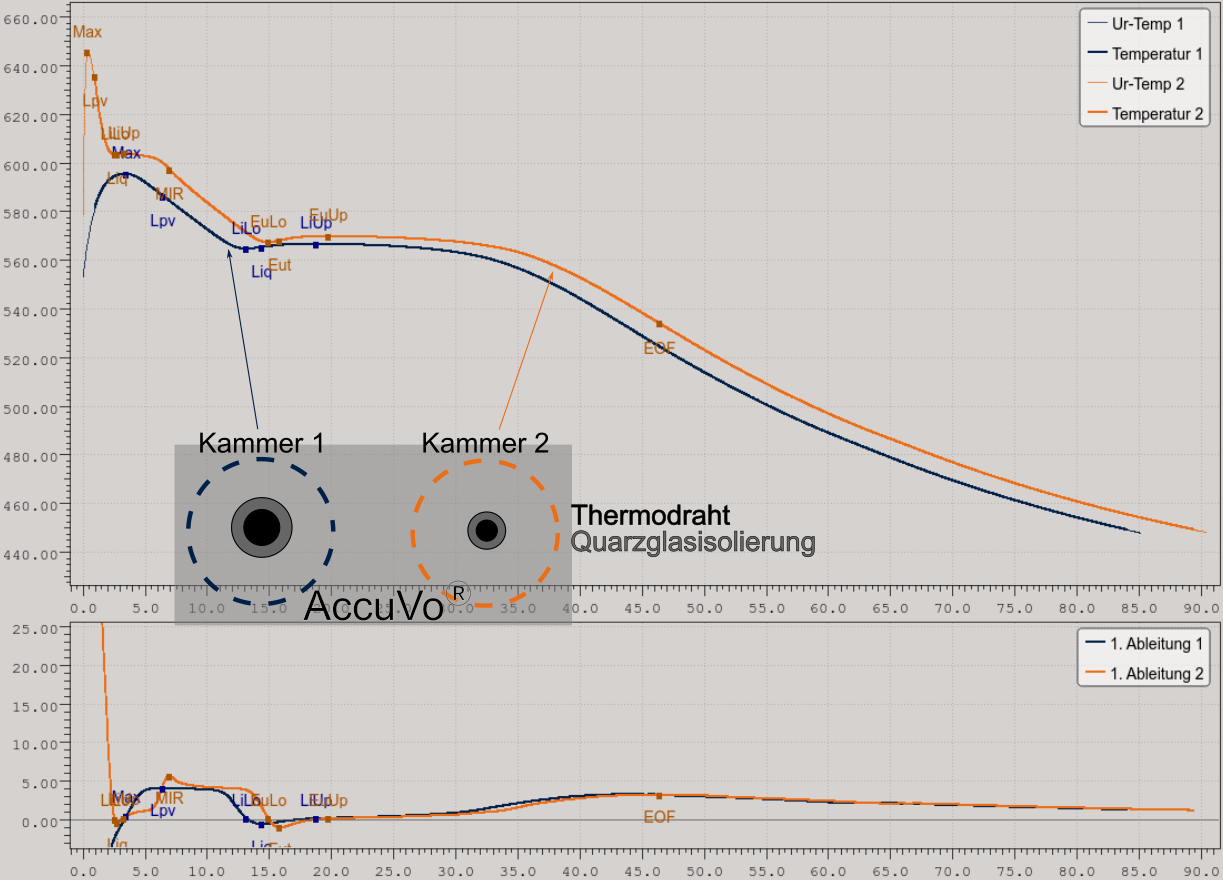
From the obtained results (temperatures), the thermal analysis method offers the possibility to draw conclusions about the metallurgical condition of a melt (e.g. inoculation, degree of saturation, grain refinement, modification) and thus to provide in-process information on the control or correction of the melt according to the quality specifications. Precise and fast temperature measurement is indispensable for the utilization of information from exothermic/endothermal reactions during the cooling / solidification of metal melts, for example with regard to inoculant solubilities and effects (see Fig. 3, apromace data systems GmbH, Technical Service Kuehn GmbH) shrinkage formation or the reliable determination of liquidus temperature for very dynamically solidifying material systems (see Fig. 4, apromace data systems GmbH, Technical Service Kuehn GmbH).
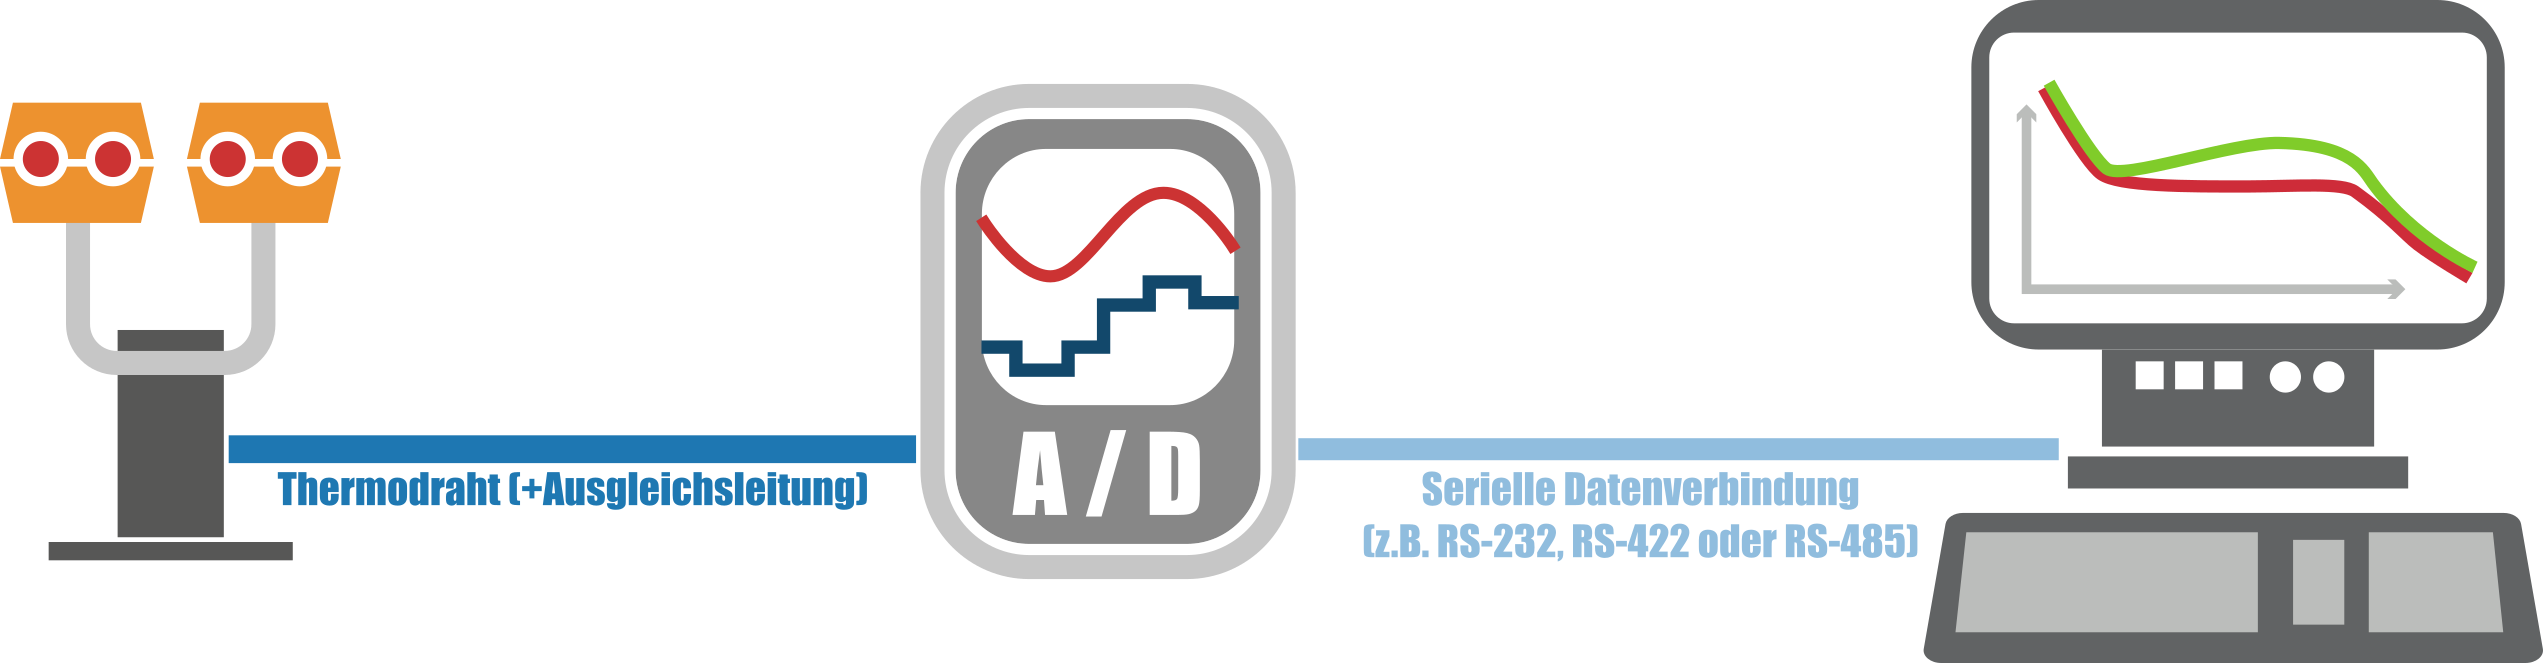
The quality of the results of the thermal analysis is determined by the complete measurement chain, which is made up (for example) of
- thermocouple (in the cup) (temperature sensor),
- thermos wire
- compensating lead and
- analog/digital converter
(see Fig. 5, apromace data systems GmbH, Technical Service Kuehn GmbH).
Using the example of the mean eutectic temperature of 1150 °C. Table 2 shows the individual measurement errors according to the valid industry standards and for a measurement system with optimized precision
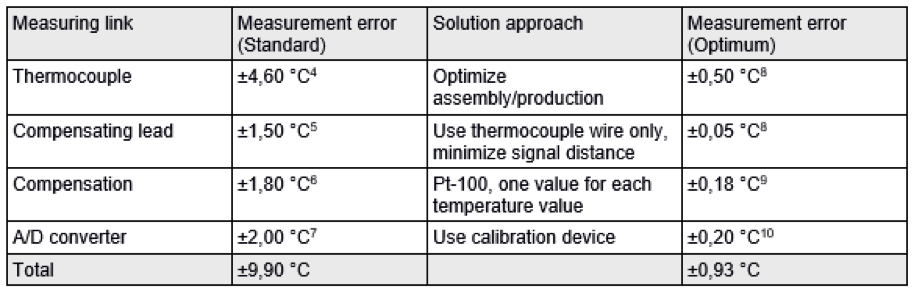
Table 2: The sum of the expected individual errors calculated for a temperature of 1150 °C11
For the determination of the degree of saturation from the liquidus temperature according to Czikel & Hummer12, an error of ±0.21% (instead of ±2.22% for ±9.90 °C) results for the optimized electrode with a temperature measurement error of ±0.93 °C at 1150 °C.
A further influencing factor with regard to the significance of a thermal analysis in foundries is the frequency of the analog/digital converter in connection with the downstream signal processing of the raw data by the TA software (smoothing, derivation, etc.). In case of poor temperature data quality and low conversion rate, the results of the automated evaluation of the cooling curve can deviate significantly from the expected values according to the raw data curves!
The course of the cooling curves depends on the alloy, endothermic and exothermic processes during cooling and the cooling rate. The cooling rate again depends on the heat capacity, heat conductivity and temperature of the cup as well as the heat transfer between melt and cup. For the cooling curves to be comparable with each other, it is important to keep the parameters as constant as possible. This is where the double chamber AccuVo® - cup can be used. Here the parallel analysis of treated and untreated melt provides a precise tool to evaluate, on the basis of a known concentration of the treatment agent with an internal reference, and to obtain online conclusions for the control of the melting operation. Furthermore, a precise measurement of the cooling curve is necessary in order to detect the smallest possible sub-cooling at maximum cooling speeds. The joint product for thermal analysis apromaceTA of the two companies apromace data systems GmbH and Technical Service Kuehn GmbH offers these possibilities with a maximized rate of analog/digital conversion with optimized precision of the thermocouples and reproducible solidification volume (AccuVo® double chamber cup) as well as effective data processing algorithms.
Sources:
[1] DIN 51005
[2] apromaceTA
[3] VDG Merkblatt (BDG-Richtlinie) P 350 (Stand: 09/2009)
[4] DIN EN 60584-1 (Klasse 1 Thermoelement)
[5] DIN EN 60584-3 (Ausgleichsleitung der Genauigkeitsklasse 1)
[6] Exemplary for an apromace TA cold junction temperature measurement in a melting plant (iron foundry)
[7] National Instruments 9211 (Datenblatt)
[8] Private Communication, Technical Service Kuehn GmbH
[9] DIN EN 60751 (Genauigkeitsklasse AA für eine Kaltstellentemperatur von 45 °C)
[10] Beamex MC2 Prozesskalibratoren (Benutzerhandbuch)
[11] F. Hanzig, „Temperaturmessung in der Themoanalyse: Fehlerquellen & Optimierungspotenial“ VDG-Seminar „Qualitätsüberwachung von Eisenschmelzen durch thermische Analyse“, 03./04.05.2018
[12] J. Czikel, R. Hummer „Volle Qualitätsbestimmung von Gußeisen mit Hilfe der thermischen Analyse“ Gießerei- Praxis 21 (1977), 325–333