TTT chart
Graphic illustration of the transformation processes in the structure of alloys as a function of temperature and time.
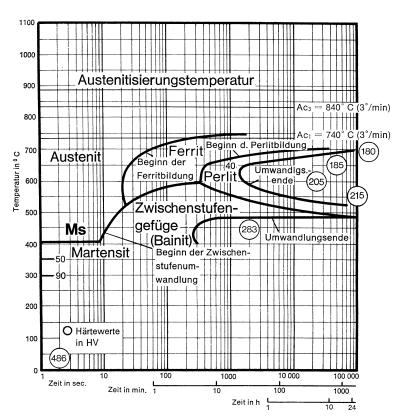
TTT charts are available for isothermal treatment (figure 1) and continuous cooling (figure 2). Diagrams for isothermal treatment can be used for thermal treatments carried out at constant temperatures while diagrams for continuous cooling are used for the assessment of heat treatments associated with constant cooling, in particular with quenching. With regard to quench hardening, the TTT diagram only provides an approximate overview and not the direct measure of hardenability.Isothermal treatment:The isothermal TTT diagram describes the relationship between the holding temperature and the holding time and the austenite transformation process. The samples heated to austenitization temperature are quickly quenched down to a certain temperature and then maintained at this temperature for a longer period of time. The transformation of austenite only starts after a certain delay which depends on the temperature. This delay, also referred to as warm-up time, initially decreases with increasing supercooling and then increases after having reached a certain minimum. The time between transformation start and transformation end is referred to as transformation rate.
The isothermal TTT diagram is read off along the holding temperature. The values indicated in the diagram (figure 1) in the fields with structure designations show the %-shares of different structures. The values at the end of the cooling curves are the hardness values in HV to be expected for the structure formed during this cooling process. The main field of application of isothermal diagrams is the specific transformation into a certain structure, e.g. for austempering.Continuous cooling:
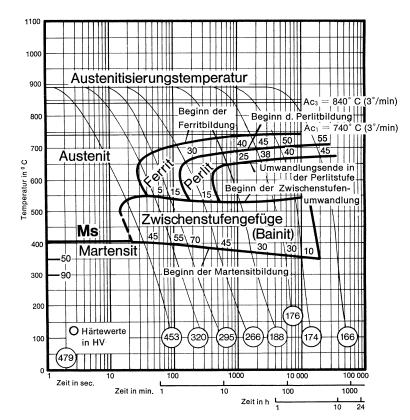
The continuous TTT diagram describes the relationship between cooling rate (time) and the process of austenite transformation. The samples heated up to austenitization temperature are cooled down at different rates. In this process as well, the transformation of austenite only starts after a certain delay which depends on the temperature (warm-up time). The transformation rate is at a maximum for transformation temperatures with the fastest warm-up time. The continuous TTT diagram is read off along the cooling curves. The values for the structural elements and hardness plotted in figure 2 must be read off analogously to the isothermal TTT diagram. In practice, the continuous diagrams are more important than the isothermal diagrams since most of the heat treatments are made on the basis of continuous cooling.
Each material type has its own TTT diagram, both for isothermal TTT diagrams and for continuous cooling, since even minor differences in the austenitization temperature as well as in the analysis influence the structural transformation and the hardness to be reached.