Electron probe micro analysis
A micro analysis (EDX/WDX) carried out using a scanning electron microscope (SEM) on a prepared (sanded and polished) sample.
To determine the chemical composition of the sample which is to be tested, the x-ray spectrum emitted by the sample must be dissected. There are two different methods of doing this. In energy dispersive x-ray spectrometry (EDX analysis) , a detector crystal which is polarized as a diode in a non-conducting direction and is under high voltage is used.
This is made of silicon fortified with lithium or of HPGe (high purity germanium). Typical detector surfaces are 10, 30, 60mm2. To prevent disruptive internal noise (multiple formation of electron-hole pairs in the semiconductor crystal with increasing temperature) at room temperature and the diffusion of the lithium (Li) in the crystal, the crystal and the preamplifier are cooled to the temperature of the liquid nitrogen. This is contained in an evacuated dewar and cools the crystal and the preamplifier via a cold finger made of copper. To prevent a contamination and formation of ice on the crystal, it is shielded by a thin detector window facing the sample. In the past, this was made from beryllium (Be), through which x-ray quanta with an energy of
An x-ray quantum which hits the crystal creates an energy in it which is proportional to the number of electron-hole pairs. To create such an electron-hole pair, 3.8eV are needed in an Si(Li) detector, in a HPGe detector 2.9eV. These can be tapped and strengthened as a voltage pulse on the crystal. In a pulse height analyzer (multichannel analyzer: a range of impulse counters, each of which is allocated a specific energy – usually 10eV per channel – a registered impulse increases the count by one unit), their energies can be assigned according to their count.
An EDX detector has a relatively long downtime - this means that, after registering a photon, the detector needs a certain amount of time before it is ready to detect the next photon.
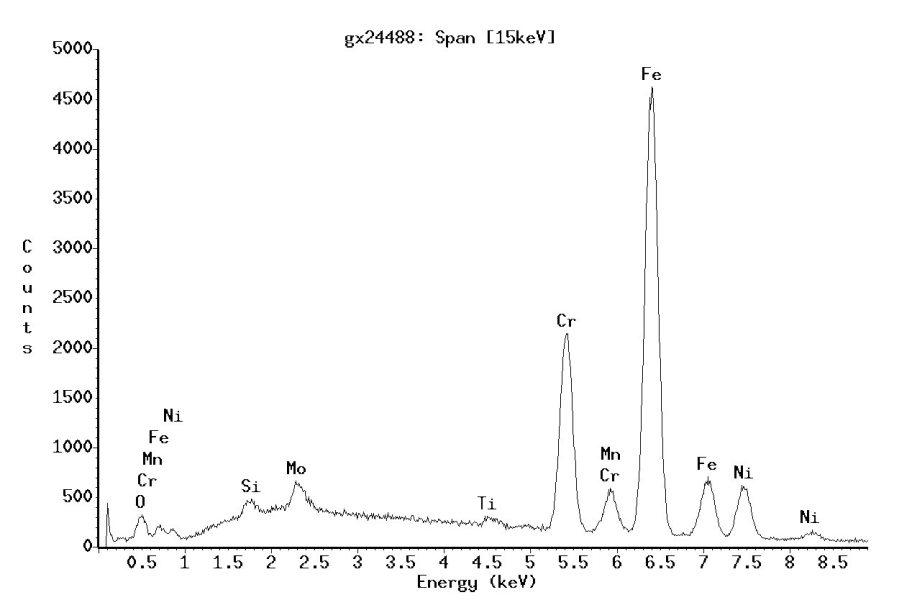
The elements in the sample can be inferred from the individual x-ray lines (Figures 1 and 2). The concentration can be calculated using quantitative process from the relative intensity of the x-ray lines in relation to one another. EDX systems have become widely used as they can capture the entire x-ray spectrum at the same time and statements about the chemical composition of the sample are possible after only a short time. In the ideal case, the sensitivity of detection is around 0.1% by weight. The energy resolution (given for MnKα) is around 130 eV. The analytical resolution is dependent on the excitation energy and the thickness of the sample material being examined and lies in the micrometer range (microanalysis).
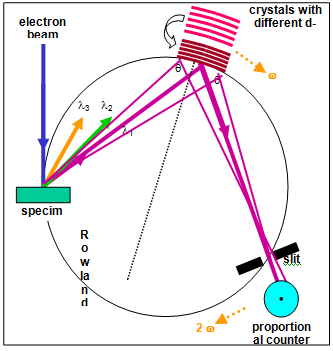
In a wavelength dispersive x-rayspectrometer (WDX) the x-ray quanta which occur on a crystal which is optimum for the energy/wavelength which is to be measured according to the Bragg’s law (n·l = 2·d·sin α) are bent (Figure 3). The x-ray quanta are registered with a proportional counter which lies on the so-called Rowland circle with the sample and the curved analyzer crystal (Figure 4).
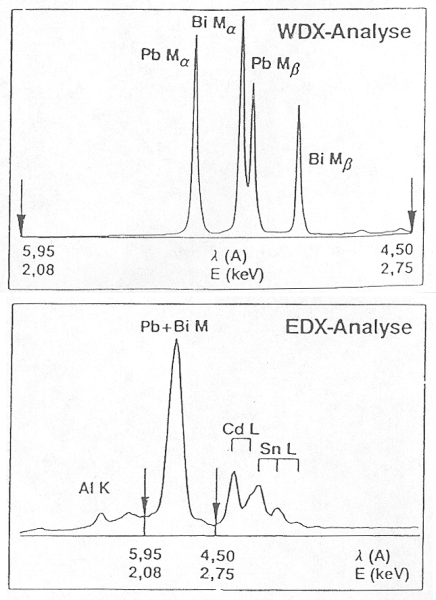
In the ideal case, the sensitivity of detection is around 0.1% by weight. The energy resolution is around 10eV. This allows the x-ray lines which are superimposed on one another in the EDX spectrum to be separated from each other and quantified with greater accuracy (Figure 5). As each wavelength must be measured more or less in series, the measurement times with WDX are considerably longer. The beam currents required for the measurement are also considerably higher (factor 100) than in EDX analyses. Therefore, the samples must not be sensitive to radiation - not a problem with metals and ceramics.
Further references:
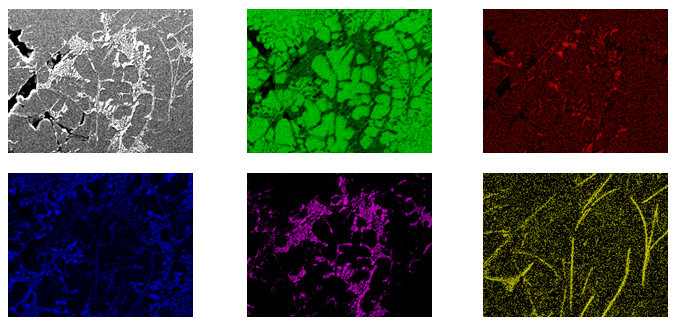
Element distribution
(This entry comes from Hartmuth Schröttner, FELMI-ZFE-Graz, Austria