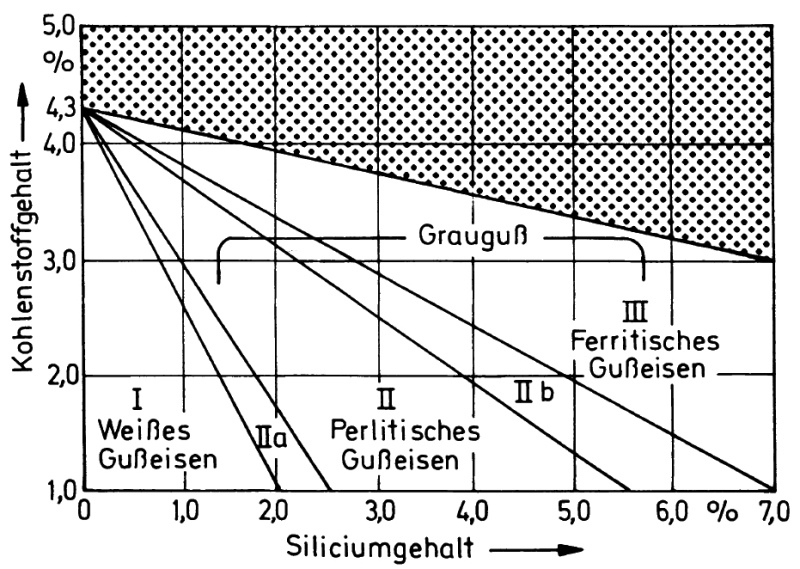
Maurer diagram
Represents the influence of the carbon and silicone contents on the basic structure of cast iron alloys (s. Structure formation of cast iron). The diagram was developed by E. Maurer in 1924 using 30mm test rods.
The three main fields represent white cast iron (I), pearlitic cast iron (II), and ferritic cast iron(III). Mottled cast iron (IIa) and pearlitic-ferritic casts iron (IIb) are transition fields. The diagram is limited towards the top, as higher carbon contents lead to the formation of kish graphite (rasterized in Fig. 1).
Additional references:
Laplanche diagram
Metal matrix of cast iron