Smith diagram
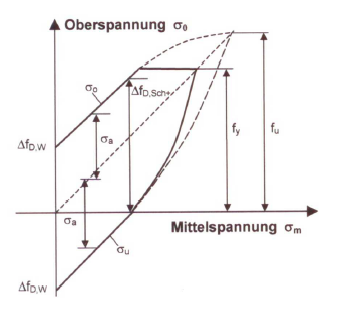
To determine the stability of dynamically strained components in materials engineering, the Smith diagram (Figure 1) is used. In this respect, the dependence on average stress, amplitude, stress and endurance strength is illustrated (also compare Haigh diagram).
The upper stress level δo or the lower stress level δu are applied as function of the average stress level δm. The diagram is cut off by a line that runs parallel to the x-axis at the height of the yield strength as constant stress over this range is not admissible. This way, plastic deformation is prevented.
The diagram clearly illustrates the connection between average stress, stress amplitude, upper stress level and lower stress level. The Smith diagram only applies for a defined number of load reversals. This means, it is a cross section through the Wöhler curve. The higher the notch effects and internal stresses of a component the more the Smith diagram resembles two parallel lines, i.e., the stress difference Δδ = 2 δa is almost constant.