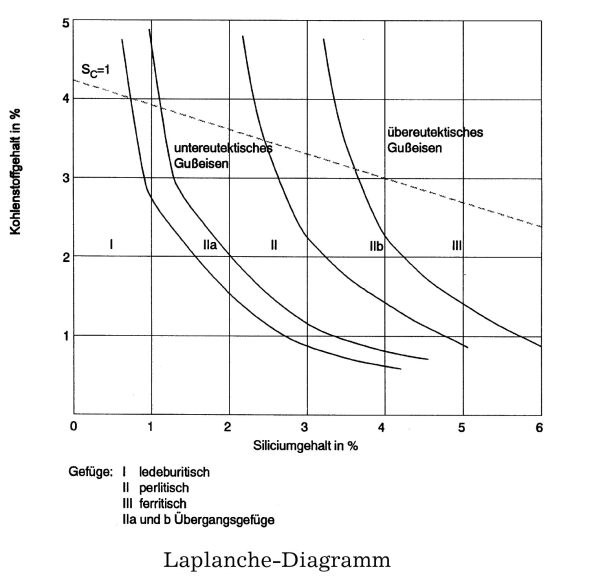
Laplanche diagram
This diagram (Fig. 1) represents the cast ironstructure (s. Structure formation of cast iron) as a function of the carbon and silicone content of the alloy, similar to the Maurer diagram.
The course of the boundary lines is determined by a factor which captures the tendency for graphitization (s. Graphitization) and whose interdependence with the carbon and silicone content can be expressed by a mathematic formula (eq. 1):
Eq. 1: ![]()
The individual boundary lines of the structure fields correspond to different factor values.
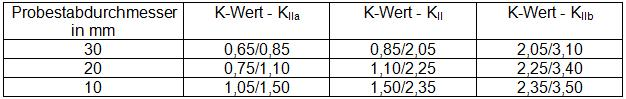
Table 1 shows how the factors are changed by different cooling conditions.